Home › Deliverability Hub › Studies › Placement Test Log
Placement test log
Every placement test we ran on prewarmed inboxes
We build a new batch of prewarmed domains and inboxes every month and seed-test it before any of it reaches a customer. 8 tests so far, 515,190 messages sent and 469,331 scored, published whole.
The data behind this study
Every figure on this page is computed from these files. Fieldwork March to October 2026. Licensed CC BY 4.0: reuse with attribution to WarmInboxes.com.
8
monthly tests
469,331
messages landed and scored
95.17%
reached the primary inbox
88.41%
worst month (Jul)
Nothing is deployed below 95%. The test scores every inbox and domain in the month’s batch, one at a time. The ones that clear 95% inbox placement go into the pool; the ones that do not are thrown out. Each figure below is the whole batch’s average before that filtering, so a low month never means weak stock shipped — it means more of that month’s batch was discarded.
So read this as a barometer, not a scorecard. Each month’s figure is a fresh batch of infrastructure meeting the receivers as they were that month, scored before anything is filtered out, which makes the series a fairly direct read on how hard inboxing was getting. It sat near 99% through spring, fell to 88.41% by July 2026, and is back to 94.47% in October 2026. Anyone sending cold email through 2026 lived through the same summer; most of them are not publishing what it did to them.
The damage was not spread evenly, and that is the useful part. Google-sent mail held throughout — Google into Google is the only route measured in every single test and it never dropped below 93.83%. Azure into Google is the one that broke: 100% in Mar, 0.22% at the bottom, 97.99% once it came back. Which is why we sort lists by recipient platform before buying anything — the free ESP segmenter does it from a CSV, and the inboxing playbook has the routing rules in full.
The log
Month by month
Inbox and spam are shares of what the seed list received, not of what was sent. Where received is well below sent, part of the list did not accept the message at all, which is a different failure from landing in spam and is kept visible rather than folded in. Volume varies a lot between tests, so read the rate next to the count beside it.
| Test | Sent | Received | Inbox | Spam | Inbox rate |
|---|---|---|---|---|---|
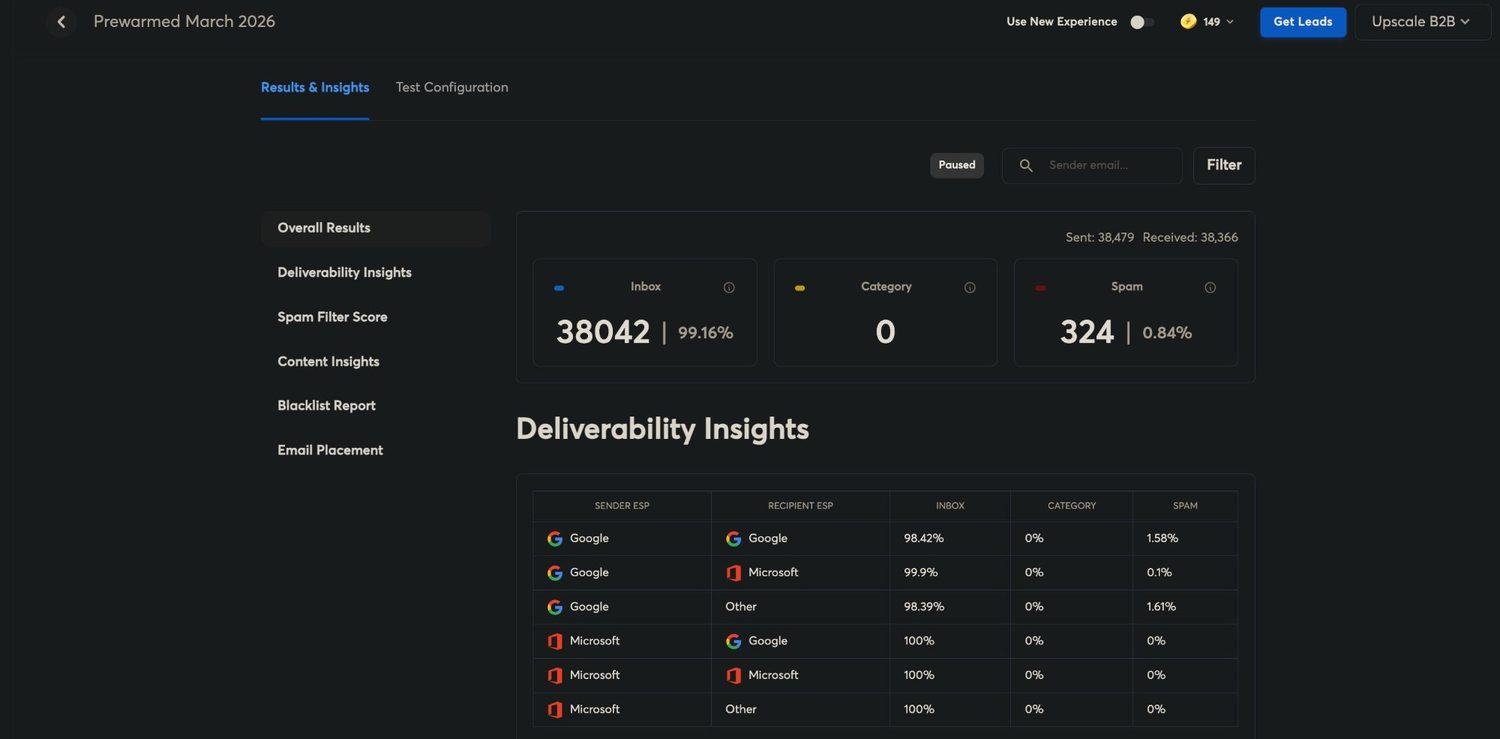
| March 2026 | 38,479 | 38,366 | 38,042 | 324 | 99.16% |
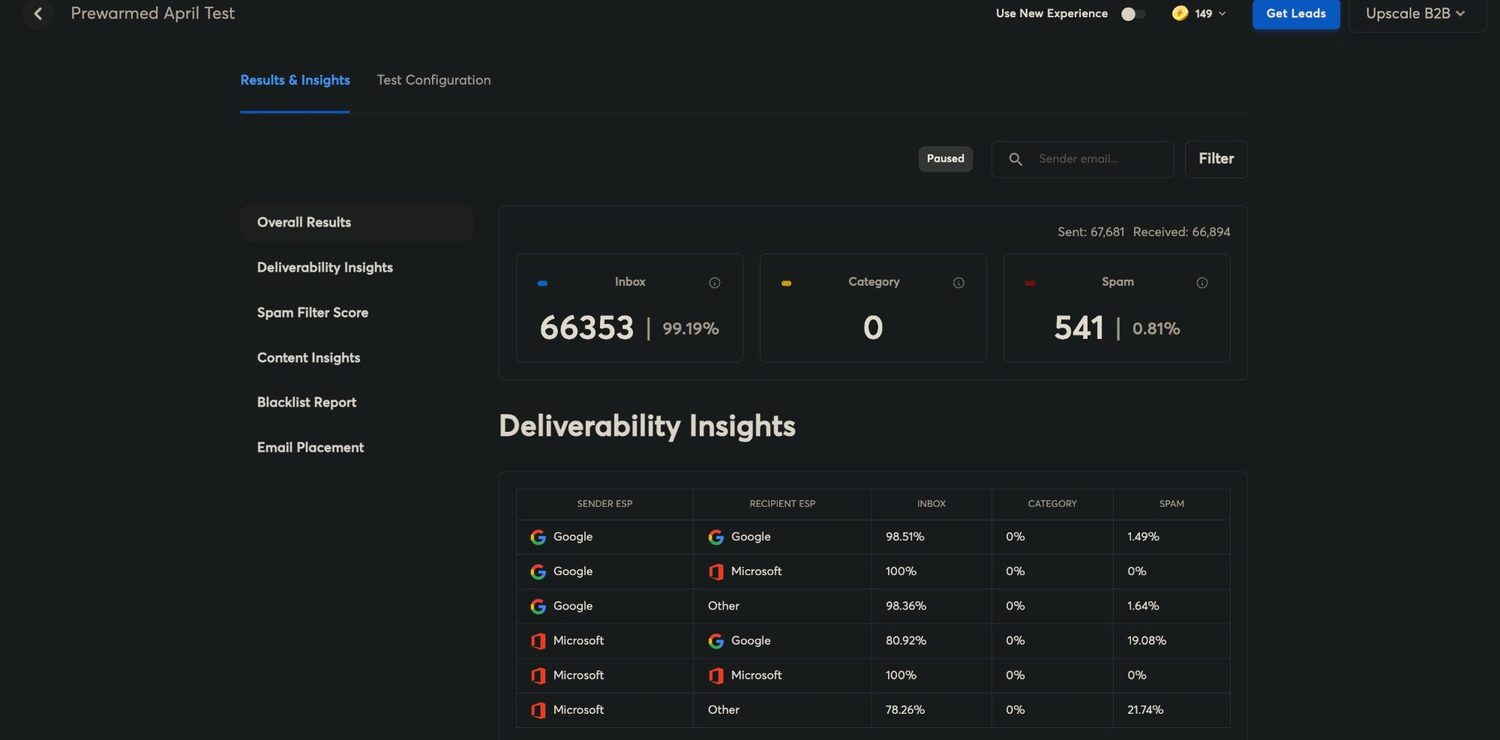
| April 2026 | 67,681 | 66,894 | 66,353 | 541 | 99.19% |
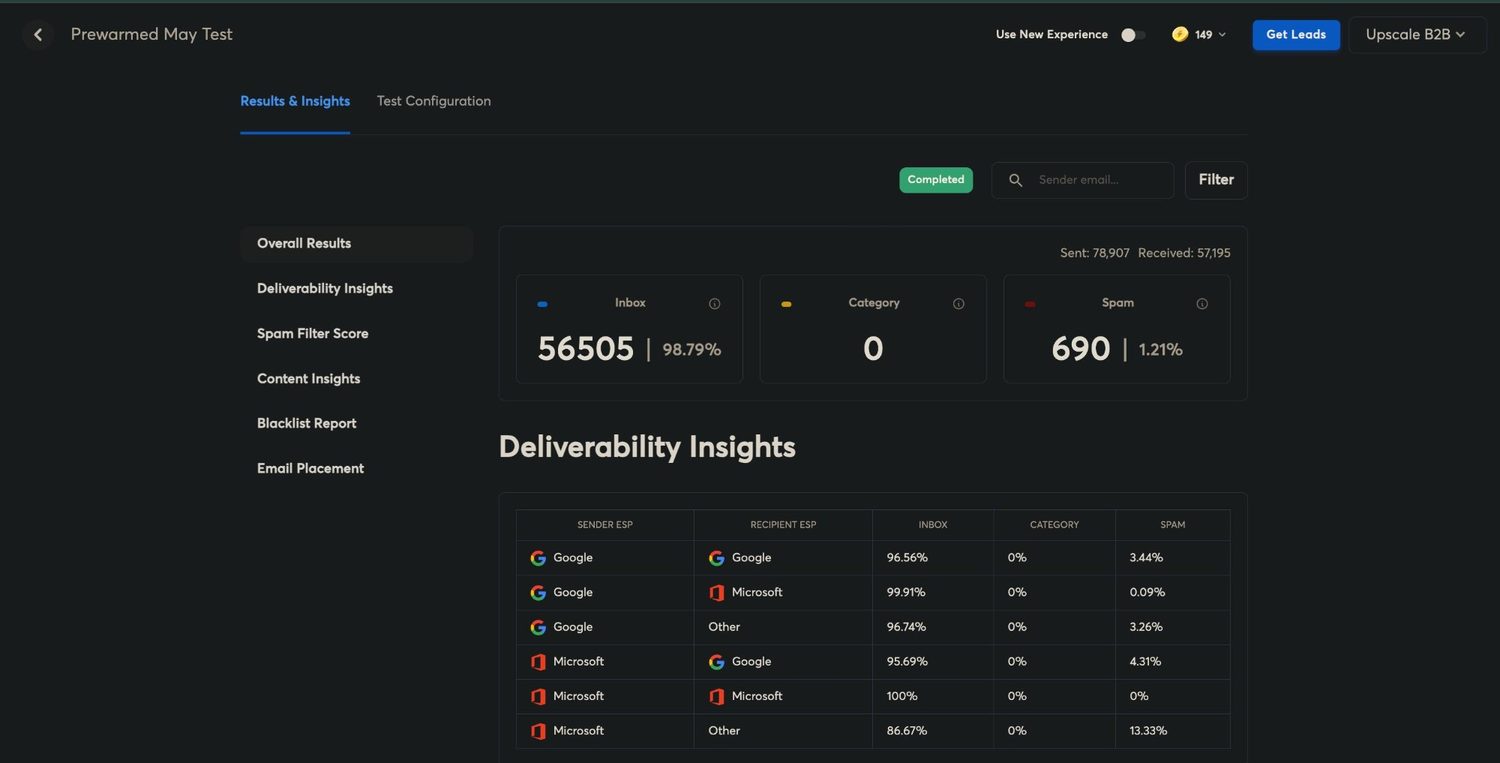
| May 2026 | 78,907 | 57,195 | 56,505 | 690 | 98.79% |
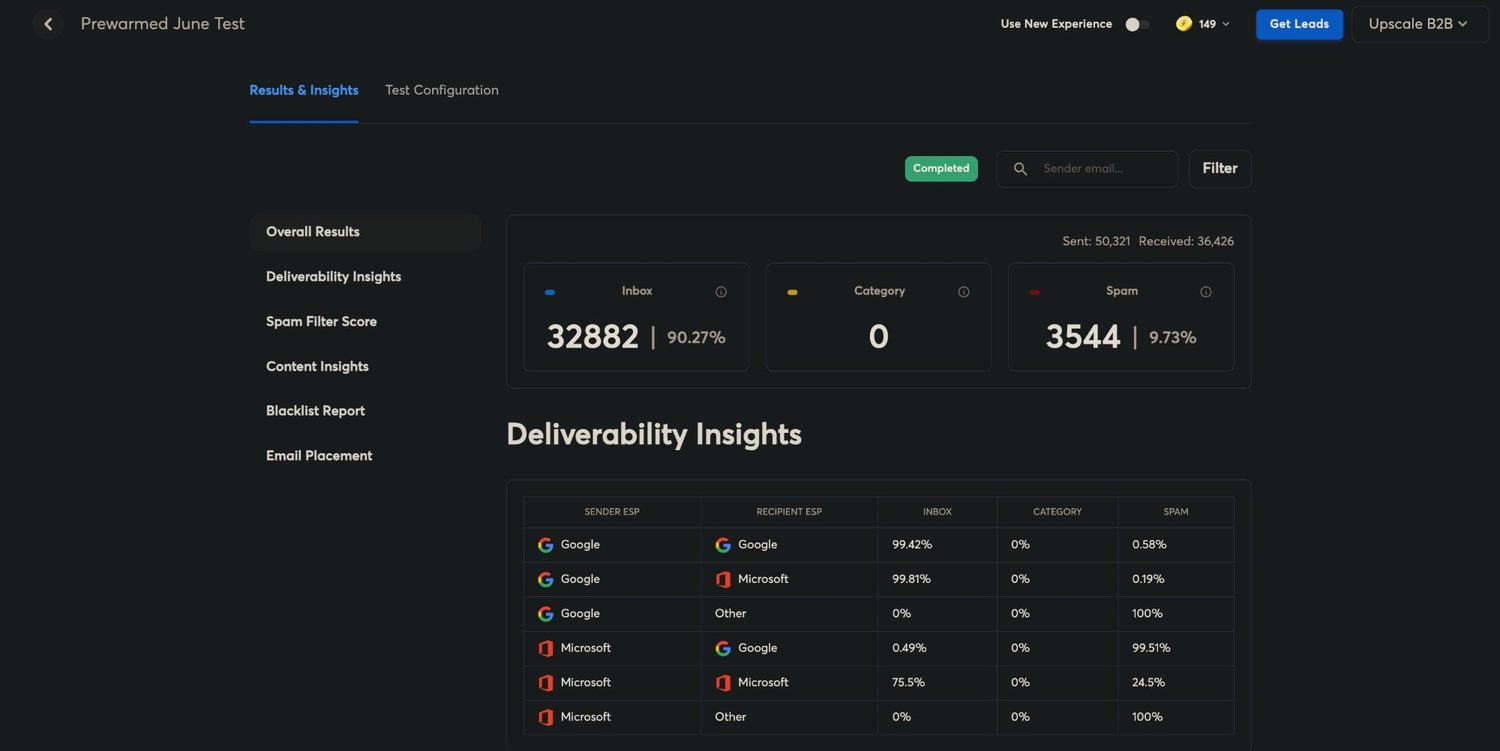
| June 2026 | 50,321 | 36,426 | 32,882 | 3,544 | 90.27% |
| July 2026 | 62,928 | 58,169 | 51,428 | 6,741 | 88.41% |
| August 2026 | 3,004 | 2,983 | 2,955 | 28 | 99.06% |
| September 2026 | 78,270 | 73,698 | 70,376 | 3,322 | 95.49% |
| October 2026 | 135,600 | 135,600 | 128,100 | 7,500 | 94.47% |
| All 8 tests | 515,190 | 469,331 | 446,641 | 22,690 | 95.17% |
Inbox rate by month
Scaled from 80% so the movement is visible — a zero baseline would draw 8 near-identical columns. The figure under each month is how many messages it scored: Aug ran 2,983, 0.6% of the total, so its 99.06% is the least load-bearing number on this page.
By route
Which sender reached which inbox
Inbox percentage for each sender-to-recipient pair, month by month.
These percentages carry no volume. The platform reports placement per route without saying how many messages went down each one, so a route reading badly in a month that reads well overall — June is 90.27% — is a route that was tiny. Read this table for direction and the one above for magnitude, and do not multiply one by the other. A dash is not a zero. It means nothing was sent down that pair, so there is no placement to report. The platform writes some of those as 0%, which would read here as total failure, so they are drawn as dashes like every other absence. The reasons are below the table.
| Sender → Recipient | Mar | Apr | May | Jun | Jul | Aug | Sep | Oct | Worst |
|---|---|---|---|---|---|---|---|---|---|
| Google → Google | 98.42% | 98.51% | 96.56% | 99.42% | 93.83% | 98.89% | 97.30% | 94.34% | 93.83% |
| Google → Microsoft | 99.90% | 100% | 99.91% | 99.81% | 82.24% | 99.79% | 92.17% | 89.58% | 82.24% |
| Google → Other | 98.39% | 98.36% | 96.74% | — | 85.10% | 89.74% | — | — | 85.10% |
| Azure → Google | 100% | 80.92% | 95.69% | 0.49% | 0.22% | — | 86.35% | 97.99% | 0.22% |
| Azure → Microsoft | 100% | 100% | 100% | 75.50% | 99.80% | — | 100% | 98.05% | 75.50% |
| Azure → Other | 100% | 78.26% | 86.67% | — | — | — | — | — | 78.26% |
- June 2026:
- Nothing went to Other-provider recipients from either sender in June, so both Other rows are absent. The platform prints 0% for a pair with no sends, which is not a placement result.
- July 2026:
- No Azure sender reached an Other-provider recipient in July — nothing was sent down that pair. Google into Other ran normally and is in the table.
- August 2026:
- We built no new Azure prewarmed in August, so the batch had no Azure-sender inboxes in it. The three Azure rows are absent, not zero.
- October 2026:
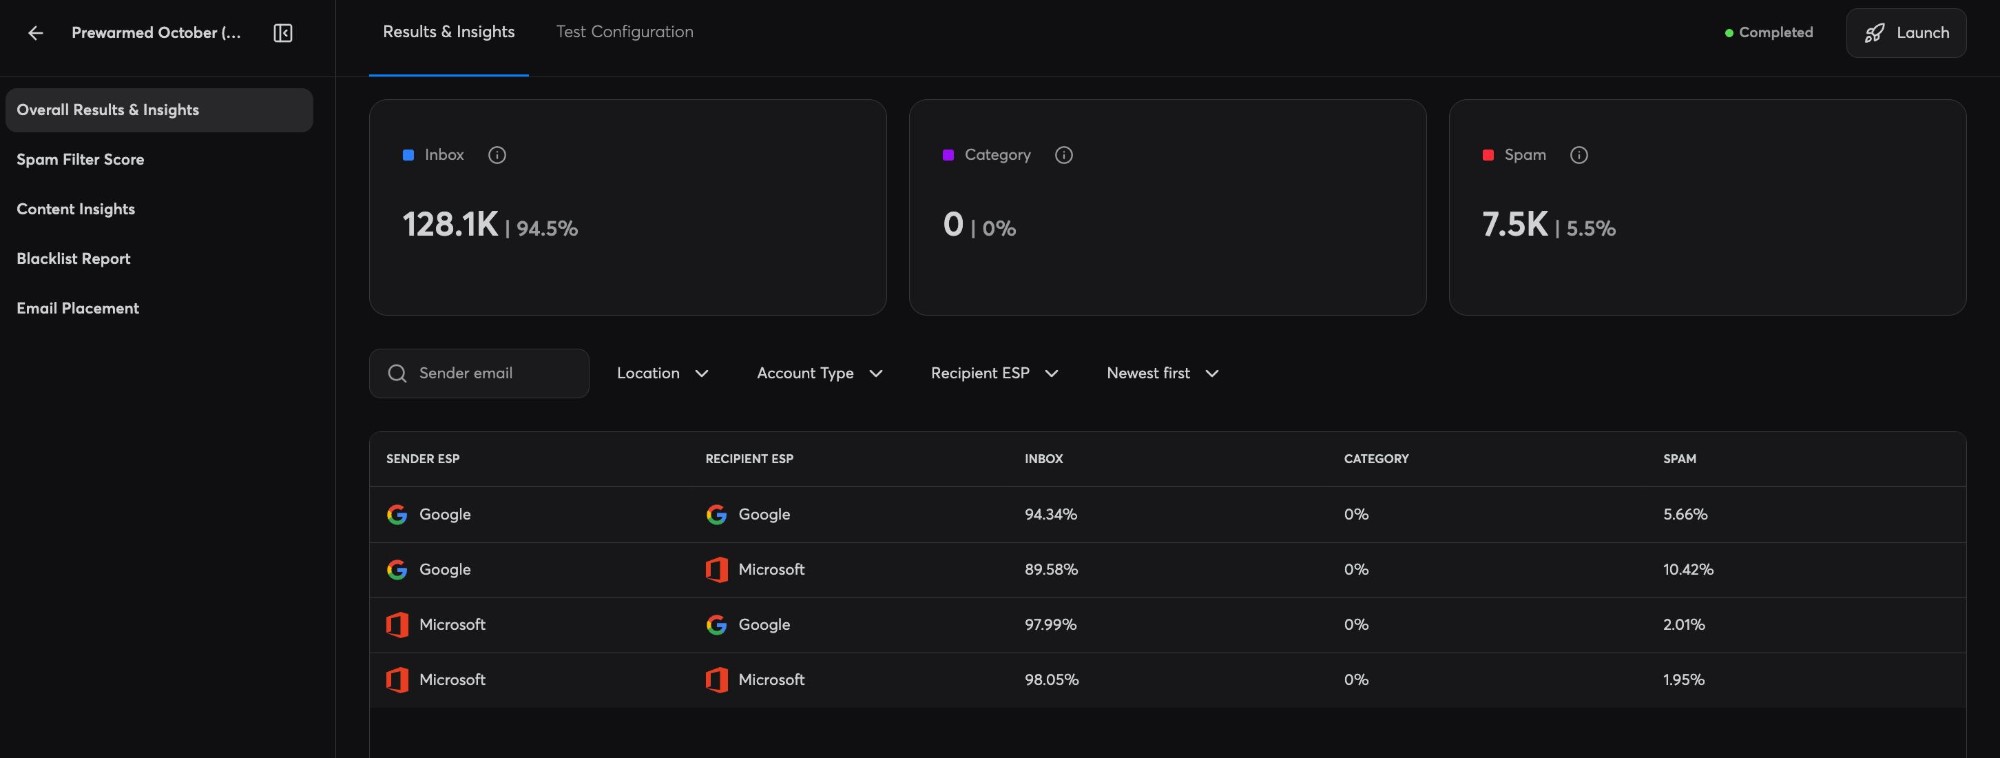
- Nothing went to Other-provider recipients from either sender in October, so both Other rows are absent. The platform’s newer results screen prints no row at all for a pair with no sends, where the old one printed 0%; both mean not tested. That screen also rounds its totals, to 128.1K inbox and 7.5K spam, and does not show how many were sent, so October’s counts are to the nearest hundred and sent is recorded as equal to received. The percentages are the screen’s own.
Google senders were the resilient ones. Google into Google is the only route exercised in all 8 tests, and it never dropped below 93.83% — including in the two months everything else did.
Azure into Google is where it broke. 100% in Mar, 97.99% by Oct. Azure senders kept reaching Microsoft recipients almost perfectly over the same period, so this is not a problem with the sending infrastructure — it is Google deciding differently about who it accepts mail from.
That is the whole case for routing by recipient rather than sending everything from one place, and we did not set out to prove it here. It fell out of a seed test designed only to measure placement. Paste a list into the ESP segmenter to see what your own split looks like, or work the cost through in the infrastructure calculator once you know it.
Method and limits
How to read this
- Tested before deployment, not after. Each test runs on a month’s new batch of prewarmed domains and inboxes before any of it is sold. Every inbox is scored individually and joins the pool only if it clears 95%, so these figures are acceptance scores for a whole batch, not a report on live customer sending.
- Seed tests, not campaigns. These measure where a message lands in a panel of monitored inboxes. They do not measure reply rate, and a high placement rate is not a promise of replies.
- Prewarmed infrastructure only. Every test ran on prewarmed inboxes. Fresh inboxes and bought-in stock behave differently and are not in this log — our SURBL study measures that gap from the blocklist side, where bought-in domains came back listed more than twice as often as the ones we build.
- Received, not sent, is the denominator. In May and June the seed list accepted about 72% of what was sent. That is a separate failure from spam placement and it is shown rather than absorbed.
- Category is zero throughout. The platform reports a Promotions-style category column and it read zero in every test, so it is left out of the tables rather than printed as a column of zeroes.
- A 0% from the platform is an absence, not a result. Where the results screen prints 0% against a sender-recipient pair it means nothing was sent down that pair. It is the same thing as a blank cell, written differently, so it is drawn here as a dash with the reason under the table. The two sub-1% figures that remain — 0.49% and 0.22%, both Azure into Google — are real: mail went, almost none of it landed.
- A live log. A new batch is built and tested every month, and the result is added here when it completes. The series is the closest read we have on the state of inboxing month to month.
- 8 months is a trend, not a law. Placement moves with what the receivers are doing, and this is a short window on one fleet.
Proof
The results screens themselves
Every number in the tables above is read off one of these. All 8 tests are pictured, in order, including the two months that went badly.
Prewarmed March 2026
38,479 sent · 38,366 received · 38,042 inbox (99.16%) · 324 spam (0.84%) · category 0
Prewarmed April Test
67,681 sent · 66,894 received · 66,353 inbox (99.19%) · 541 spam (0.81%) · category 0
Prewarmed May Test
78,907 sent · 57,195 received · 56,505 inbox (98.79%) · 690 spam (1.21%) · category 0
Prewarmed June Test
50,321 sent · 36,426 received · 32,882 inbox (90.27%) · 3,544 spam (9.73%) · category 0
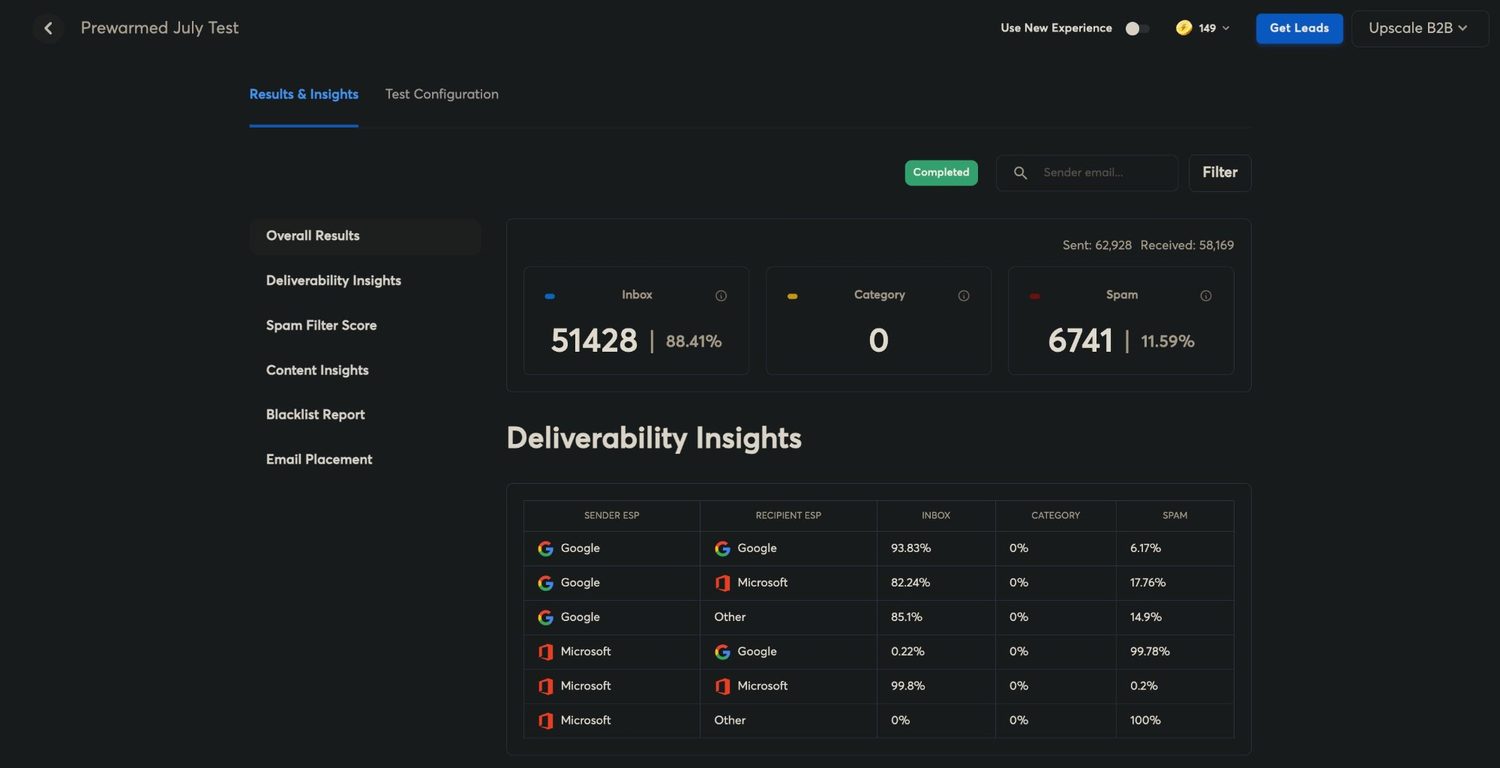
Prewarmed July Test
62,928 sent · 58,169 received · 51,428 inbox (88.41%) · 6,741 spam (11.59%) · category 0
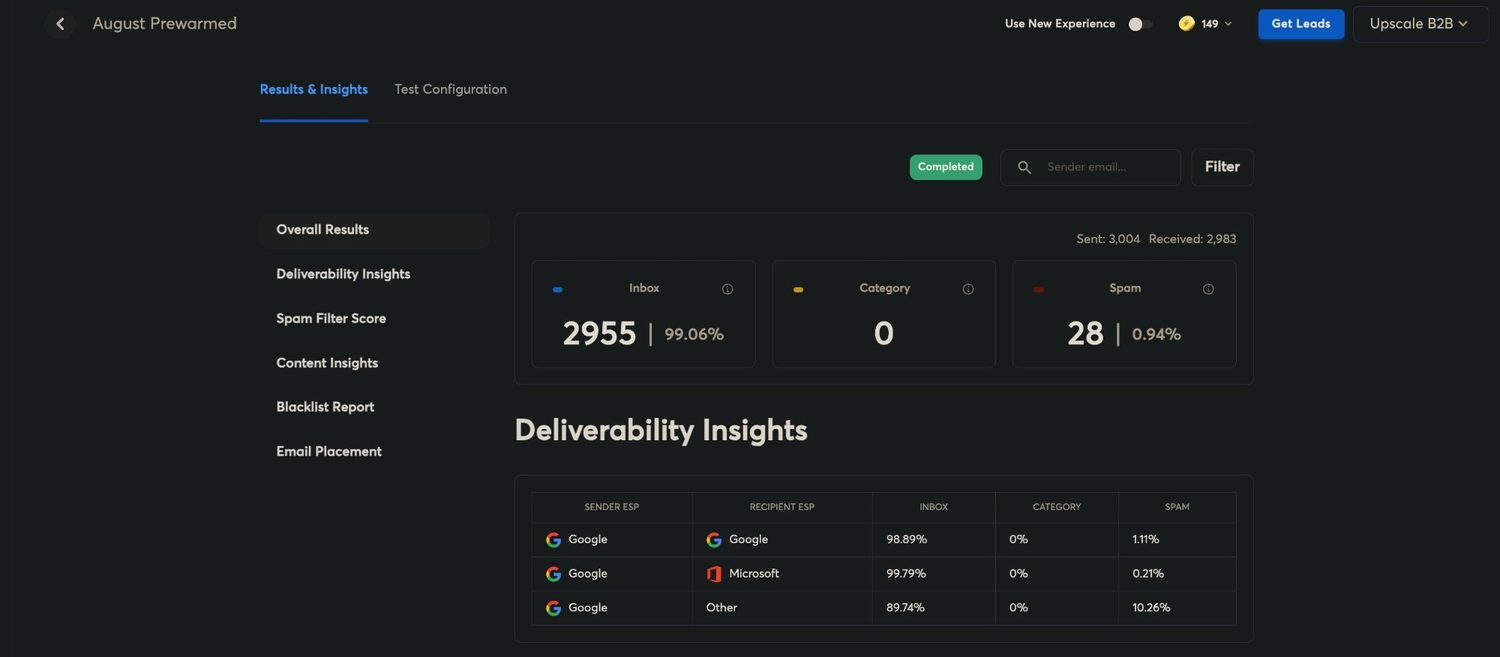
August Prewarmed
3,004 sent · 2,983 received · 2,955 inbox (99.06%) · 28 spam (0.94%) · category 0
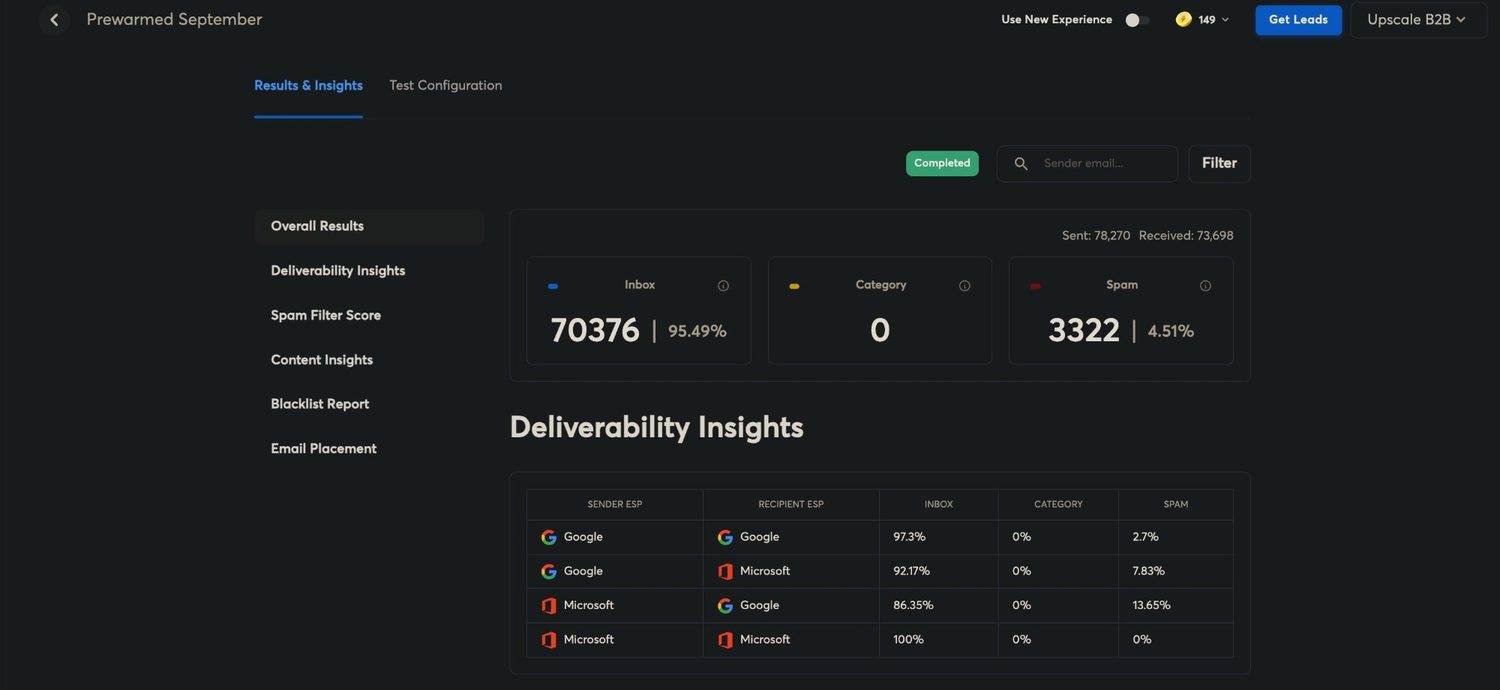
Prewarmed September
78,270 sent · 73,698 received · 70,376 inbox (95.49%) · 3,322 spam (4.51%) · category 0
Prewarmed October
135,600 sent · 135,600 received · 128,100 inbox (94.47%) · 7,500 spam (5.53%) · category 0
These are our own tests on our own fleet, run from the account that sends them. Nothing is cropped out of the figures: the sent and received counts, the spam column and the per-route breakdown are all on the screen as captured.
Route your sending the way the data says
Google recipients from Google inboxes is the lesson of 8 months of this. The segmenter sorts a list by recipient platform so you can buy the right mix, and it is free.
Read next
- The SURBL study — 2,817 sending domains queried, and what a blocklist listing actually costs a campaign.
- Top-level domains by sends — 3.4M sends split by TLD, and the one thing that predicts Google’s permanent domain verdict.
- Our deliverability data — campaign dashboards and routing numbers from the agency side, not the seed tests.
- All the free tools — the segmenter, the calculator and every other check, no account.
Prewarmed & Fresh Inboxes
Google, Microsoft 365 and Azure inboxes with free prewarmed domains and DNS configured before you log in. Prewarmed inboxes send the day they land; every order is delivered within 48 to 72 hours.
Get Prewarmed & Fresh Inboxes